Your Free-to-Paid Rate Is Two Numbers Pretending to Be One
Long-tenured subscribers convert three to five times better than new ones, and later cohorts are acquired more broadly than early ones. Both effects correlate with join date, so they cancel inside your blended conversion rate — and the two situations they describe call for completely opposite responses. The same-tenure comparison that separates them.

Your free-to-paid conversion rate is the product of two forces pulling in opposite directions, and a single blended percentage cannot tell you which one you are looking at.
Tenure raises conversion. Long-tenured free subscribers convert at meaningfully higher rates than recent ones — reporting in this area puts the gap around three to five times, with conversion frequently happening around month six rather than during the welcome sequence.
Acquisition breadth lowers it. Subscribers who arrived through broader, later-stage growth are less precisely matched to what you sell than the people who found you first.
Both of those correlate with when someone joined. Which means your blended rate cannot distinguish a cohort that will convert well once it matures from a cohort that was never a good fit — and those two situations call for completely opposite responses.
This guide covers the benchmarks worth using, how to separate the two effects with a same-tenure comparison, and what to do depending on which one your data actually shows.
The benchmarks, and why the spread is so wide
Published figures for free-to-paid newsletter conversion vary more than almost any other creator metric, and the variation is informative rather than noise.
Most reporting puts typical conversion under 5% of free subscribers. Real-world launch data commonly lands in the 0.5% to 2% range. Substack has published figures around 5% to 10% for what it describes as healthy paid newsletters. One study of freemium paywalls found an average closer to 0.76% measured per visit.
That is a spread of more than tenfold between the low and high commonly cited figures, which should make you suspicious of any single benchmark presented as the number to aim for. Published creator revenue breakdowns in our income report case studies show the same range in practice.
Three things drive the spread, and none of them are content quality.
What is being measured. Conversion per free subscriber and conversion per paywall visit are different denominators producing very different numbers. A 0.76% per-visit figure and a 2% per-subscriber figure can describe the same publication.
Survivorship in the sample. Benchmarks published by platforms describe newsletters that successfully launched a paid tier and kept it running. Newsletters that launched paid, converted badly, and quietly stopped do not appear in the average.
When paid was introduced. This is the largest factor and the least discussed. A newsletter that launched a paid tier at 2,000 subscribers converts a very different population from one that introduced paid after reaching 50,000, and the second reliably converts worse.
Why late paid launches convert worse
The mechanism is worth being precise about, because it is the thing most creators get wrong when they plan.
A newsletter that grew to 50,000 before offering anything paid spent that entire period optimising for free growth. The lead magnets were built to maximise signups. The content was calibrated to travel. The acquisition channels were chosen for volume.
A subscription is also not the only thing a warm cohort will buy, and selling digital products to a list converts against a different willingness threshold. None of that selects for willingness to pay. It selects for willingness to subscribe to something free, which is a much lower bar and a different population.
Then a paid tier arrives, and it converts against an audience assembled under criteria that never considered it.
A newsletter with paid from early on has been filtering for a different thing the entire time. Subscribers who stayed did so knowing a paid option existed. Content that attracted them was content that signalled the subject was worth paying for. Growth was slower and the resulting list is denser in people who convert. The tier structure you launch with shapes this too, which is the subject of membership tiers and pricing.
This is the same selection dynamic covered in our piece on why lead magnet specificity beats conversion rate — what you optimise the entry for determines who arrives.
The two effects, and why they cancel in your dashboard
Now the part that makes a blended number actively misleading rather than merely imprecise.
Effect one: tenure. Time on the list builds familiarity and trust. A subscriber who has read you for a year has considerably more evidence that your work is worth paying for than one who joined last month. Conversion for a given cohort rises as that cohort ages.
Effect two: cohort quality. Your earliest subscribers found you before you were easy to find, through genuine interest, with no marketing funnel between them and you. Later subscribers arrived through progressively broader acquisition. Conversion for successive cohorts falls as acquisition widens.
Both effects are real, both are well documented, and both correlate with join date. Your earliest subscribers are simultaneously the longest-tenured and the best-matched. Your most recent are simultaneously the newest and the most broadly acquired.
Which means when you look at conversion by cohort at a single moment, you are seeing the two effects added together with no way to tell how much of the result came from which.
And they can produce almost any blended trajectory. If tenure dominates, your blended rate rises as the list grows and you conclude growth is improving conversion. If quality dominates, it falls and you conclude something is wrong. Both conclusions are drawn from a number that contains both effects.
The same-tenure comparison that separates them
There is one measurement that isolates cohort quality from tenure, and it is not complicated.
Compare cohorts at the same age, not at the same date.
Take the cohort that joined twelve months ago and measure its conversion rate when it was six months old. Then take the cohort that joined six months ago and measure its conversion rate now, at six months old.
Both measurements are of a six-month-old cohort. Tenure is held constant. Any difference between them is cohort quality.
Run it as a small table. Illustrative figures, chosen to show what the comparison reveals rather than to represent a benchmark.
- Cohort A (joined 18 months ago), converted at 1.8% by month six
- Cohort B (joined 12 months ago), converted at 1.5% by month six
- Cohort C (joined 6 months ago), converted at 0.9% by month six
That is a clean signal. At identical tenure, each successive cohort converts worse. Acquisition quality is declining, and no amount of waiting will fix Cohort C, because the comparison already controlled for time.
Now the opposite result:
- Cohort A at month six: 1.4%
- Cohort B at month six: 1.5%
- Cohort C at month six: 1.6%
Here acquisition quality is stable or improving. If your blended rate is falling despite this, the cause is simply that recent cohorts have not yet matured — and the correct response is patience rather than intervention.
Two datasets. Two opposite diagnoses. Indistinguishable in a blended number.
The comparison needs at least three cohorts old enough to have reached the checkpoint age, which means a newsletter under about a year old cannot run it properly yet. That is a reason to start recording the underlying data now rather than a reason to skip the analysis, since the data has to exist before the question becomes answerable.
Building the cohort table, step by step
This takes about an hour the first time and fifteen minutes thereafter. Most email platforms support all of it with filters and an export.
Group subscribers by join month. Export your list with the subscription date and the current paid status. Bucket by month joined. Each bucket is a cohort.
Record the starting size of each cohort. This is the number who joined that month, not the number remaining. You will need both, for reasons covered below.
For each paid subscriber, record when they upgraded. This is the field most creators do not have, and without it the whole analysis collapses into a snapshot. If your platform stores an upgrade date, export it. If it does not, start capturing it now — you cannot reconstruct it later.
Compute conversion at fixed ages. For each cohort, count how many had upgraded by the time that cohort was three months old, then six, then twelve. A cohort that joined four months ago has a three-month figure and no six-month figure yet, which is correct rather than missing data.
Plot the six-month figure across cohorts. That single line is the answer. Falling means acquisition quality is degrading. Flat or rising means it is not, and any decline in your blended rate is maturity.
Then split by acquisition source. Same computation, segmented by where subscribers came from. This is where the actionable finding usually is, because aggregate cohort decline is frequently one channel deteriorating while others hold steady.
If you cannot do the upgrade-date step because the data was never captured, run the analysis on what you have and start recording it. Six months from now you will have a real table. The alternative is being in the same position six months from now, which is the position most creators are in.
The complication: churn contaminates the denominator
There is a methodological trap here that I have not seen addressed anywhere, and it can invert your conclusion.
When you say a cohort converted at 0.9% by month six, that is a percentage of something. Which something matters enormously.
Take a cohort that started with 1,000 subscribers. By month six, 400 have unsubscribed or gone dormant, leaving 600. Nine have upgraded to paid.
- Conversion as a share of the original cohort: 9 ÷ 1,000 = 0.9%
- Conversion as a share of the surviving cohort: 9 ÷ 600 = 1.5%
Both are correct. They answer different questions, and using the wrong one produces the wrong decision.
For forecasting, use the original cohort. You are projecting from subscribers acquired, so the denominator must be subscribers acquired. Using the surviving figure will overstate what future acquisition produces, because it silently excludes everyone who left.
For diagnosing your offer, use the surviving cohort. People who unsubscribed were never going to buy. Judging your paid tier against a denominator full of departed subscribers tells you about your churn, not about your offer.
Here is the trap. A cohort with terrible retention can show an excellent surviving-conversion rate, because heavy churn removes everyone except the most committed. Read only the surviving figure and that cohort looks like your best. Read the original-cohort figure and it may be your worst.
Report both, always, side by side. The gap between them is your churn, and churn interacts with everything else — the mechanics are covered in your newsletter's growth ceiling and the recovery options in reactivation campaigns.
What the month-six pattern means for your content
If conversion concentrates around month six rather than during onboarding, that has a consequence for what you publish and when.
A subscriber in month one is evaluating whether this is worth reading. A subscriber in month six has answered that and is evaluating whether it is worth paying for. Those are different questions and they are answered by different evidence.
The first is answered by consistency and usefulness. The second is answered by encountering something you could not get elsewhere, repeatedly enough to conclude the source is worth funding.
Which means the content that converts is rarely your most broadly appealing content. It is the material with genuine depth, original observation, or specificity that a reader could not assemble themselves — the pieces that make someone think this person knows something.
A publication running only broad, recruiting-oriented content will grow a list and convert it badly, because subscribers never encounter the evidence that would justify paying. The tension between reach-optimised and depth-optimised writing is real, and it is covered in writing newsletters people actually read.
The practical adjustment is to make sure your month-two through month-six subscribers reliably encounter your strongest work rather than only whatever published that week. An evergreen sequence surfacing your best archived pieces to newer subscribers does exactly this, and it runs automatically once configured. Monetisation tooling for the paid step sits in the monetize workspace.
What to do with each answer
If cohort quality is declining, the problem is upstream in acquisition and no conversion optimisation will fix it.
Narrow the entry. A more specific lead magnet, a clearer statement of who the newsletter is for, content that filters rather than broadens. You will grow more slowly and the people arriving will resemble the people who convert. Tag subscribers by source and check conversion by entry point — most creators discover the channel producing the most signups produces the fewest customers. Source-level measurement is covered in newsletter analytics.
If cohort quality is stable and the blended rate is falling, you have a maturity problem, which is not a problem. Recent cohorts are dragging the average because they have not aged into conversion yet. The fix is to stop looking at the blended number and forecast against same-tenure cohort performance instead.
If cohort quality is improving, whatever you changed in acquisition is working, and the compounding case for continuing is stronger than the blended rate suggests.
Forecasting with the right number
This changes revenue planning materially, and in a direction most forecasts get wrong.
The common approach takes the blended conversion rate and applies it to projected list growth. If you convert at 1.6% and expect 10,000 new subscribers, you forecast 160 new paying subscribers.
That forecast is wrong in two ways at once. It applies a rate that includes your best-converting mature cohorts to subscribers who will be new. And it books the revenue immediately, when the conversion evidence says most of it arrives around month six or later.
The corrected version uses your most recent cohort's same-tenure rate and lags the revenue. If your six-month cohort converts at 0.9%, then 10,000 new subscribers produce roughly 90 paying subscribers, arriving mostly two quarters after acquisition.
That is a substantially less exciting forecast and a considerably more accurate one. Creators who plan against blended rates consistently overestimate what growth will produce and then treat the shortfall as a performance failure rather than a modelling error. The broader economics are covered in the 0 to $10k per month strategy guide.
The lever most creators skip
Everything above is about acquisition. The larger near-term opportunity is usually the existing list.
You have already paid the acquisition cost for every current subscriber. A conversion improvement applies to all of them at once, and it applies to future cohorts too.
Make the paid tier legible. A surprising share of free subscribers do not know precisely what paid contains. Not a pricing problem, an information problem. Structuring the offer is covered in paid membership tiers.
Convert additively, not by paywalling. Launching paid by restricting content readers previously had free reads as a downgrade and generates unsubscribes. Adding something genuinely new converts better. The launch structure is covered in launching a paid newsletter.
Ask at month six, not in the welcome sequence. If conversion concentrates around month six, a hard paid pitch in week one is arriving before the evidence a subscriber needs. Use the welcome sequence to establish the reading habit, and introduce paid once the relationship has substance.
Segment the ask. Subscribers who click consistently are a different population from those who never do. Sending both the same conversion campaign wastes the more likely group and irritates the less likely one. Segmentation is a conversion lever before it is anything else.
Frequently asked questions
What is a good free-to-paid conversion rate for a newsletter?
Published benchmarks range from under 1% to around 10%, which is wide enough that no single figure is a useful target. Real-world launches commonly land between 0.5% and 2%. More useful than any benchmark is your own same-tenure cohort trend, because it tells you whether your acquisition is improving or degrading rather than how you compare to publications with different audiences and pricing.
Why is my conversion rate falling as my list grows?
Two possible causes with opposite implications. Either recent cohorts are lower quality because acquisition broadened, or recent cohorts simply have not matured yet and are dragging the average while they age. Comparing cohorts at the same tenure separates these. If each successive cohort converts worse at month six, it is quality. If they convert similarly at month six, it is maturity.
Should I launch a paid tier early or wait until my list is large?
Earlier is generally better for conversion, though it means slower free growth. A newsletter that offers paid from early on filters for people willing to pay throughout its growth. One that introduces paid at 50,000 subscribers converts against an audience assembled entirely under free-growth criteria, and reliably converts worse.
How long does free-to-paid conversion actually take?
Longer than most creators expect. Reporting in this area indicates conversion frequently occurs around month six or later rather than during onboarding, and that long-tenured subscribers convert at several times the rate of recent ones. This has direct forecasting implications: revenue from subscribers acquired this quarter mostly arrives two or more quarters later.
Does a bigger free list always mean more paid subscribers?
More, but not proportionally, and not immediately. The marginal subscriber converts at your most recent cohort rate rather than your blended rate, and converts on a lag. Doubling a list rarely doubles paid revenue, and planning as though it will is the most common source of disappointing creator revenue forecasts.
Should I measure conversion against my whole list or only active subscribers?
Both, side by side, because they answer different questions. Against the original cohort is the right denominator for forecasting, since you are projecting from subscribers acquired. Against surviving subscribers is the right denominator for judging your paid offer, since departed subscribers were never going to buy. The trap is using only the second: a cohort with heavy churn shows a flattering surviving-conversion rate precisely because churn removed everyone except the most committed, which can make your worst cohort look like your best.
My platform does not store the upgrade date. What can I do?
Run the analysis on what you have, which will be a snapshot rather than a cohort curve, and start capturing upgrade dates immediately. This is the one field that cannot be reconstructed retroactively, and six months of recording it turns a guess into a measurement. If your platform exports a paid-since or subscription-start field, that is usually sufficient.
Does pricing affect the cohort pattern?
It shifts the level rather than the shape. A lower price raises conversion across every cohort and does not change whether successive cohorts are improving or degrading, which is the thing the same-tenure comparison is measuring. Run the cohort analysis before changing price, not after, or you will not be able to separate a pricing effect from an acquisition-quality effect. If you do change price, treat cohorts either side of the change as separate series rather than one line.
What single number should I track instead?
Conversion rate of each join cohort at six months, plotted over successive cohorts. It controls for tenure, isolates acquisition quality, and gives you a forecastable figure for new subscribers. It requires only that you group subscribers by join month, which most email platforms support with a filter.
Track conversion by cohort, not by average
InfluencersKit reports subscriber source, join cohort, and paid conversion together, so you can compare cohorts at the same tenure and forecast against the number that actually predicts revenue.
Stay Updated
Get the latest insights, strategies, and tips delivered directly to your inbox. Join thousands of creators who are building their email communities with our weekly newsletter.
No spam, unsubscribe at any time. We respect your privacy.
Related Articles

Your Readers Can Leave Without Ever Seeing Your Page.
Since 2024, Gmail and Yahoo require one-click unsubscribe. A mail-app button removes the reader instantly, with no page, no options and no reason. Your preference centre now reaches only footer-link leavers, so the 'less, not none' options belong inside the email.

A Subscriber Is Worth $1.25 a Year. Now Price Your Ads.
Two sponsored slots at a $30 CPM with a 40% open rate earn about $1.25 per subscriber per year. Against a defensible CAC near $2 and cost-per-signup commonly $2-5, most paid acquisition is at or past break-even before you account for paid cohorts converting worse than organic ones.

Two Newsletters Earn $10k a Month. One Is Worth $100k More.
Same monthly income, very different sale price. Published multiples put paid subscription revenue around 24-42x MRR and sponsorship-supported newsletters closer to 20-32x, which means shifting your revenue mix beats a hard 30% growth year. The four discounts buyers apply, and why they are all decided 12-18 months before anyone makes an offer.
Apple Broke Your Open Rate. And Your Subject Line Tests.
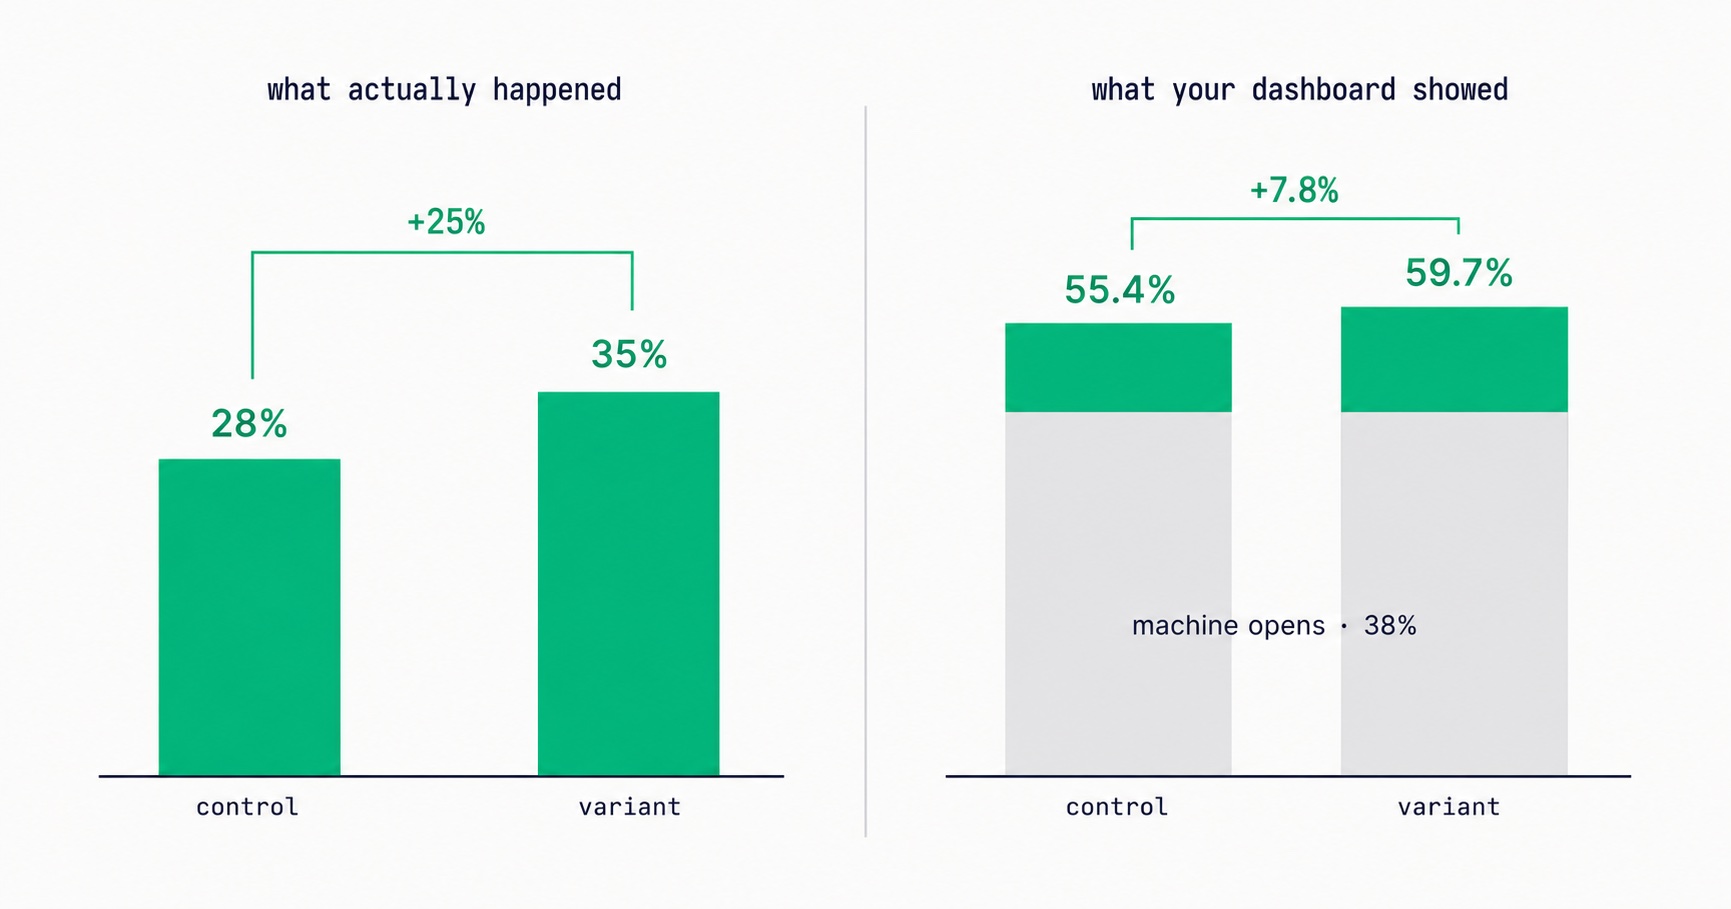
Every article about Apple Mail Privacy Protection says open rates are unreliable. None of them explain the part that actually changes your decisions: MPP doesn't add random noise, it systematically compresses the measured gap between two subject lines by roughly 3x — which is why so many creators ran good tests, saw flat results, and concluded subject lines don't matter.
Your Newsletter Has a Growth Ceiling. Here's the Formula.
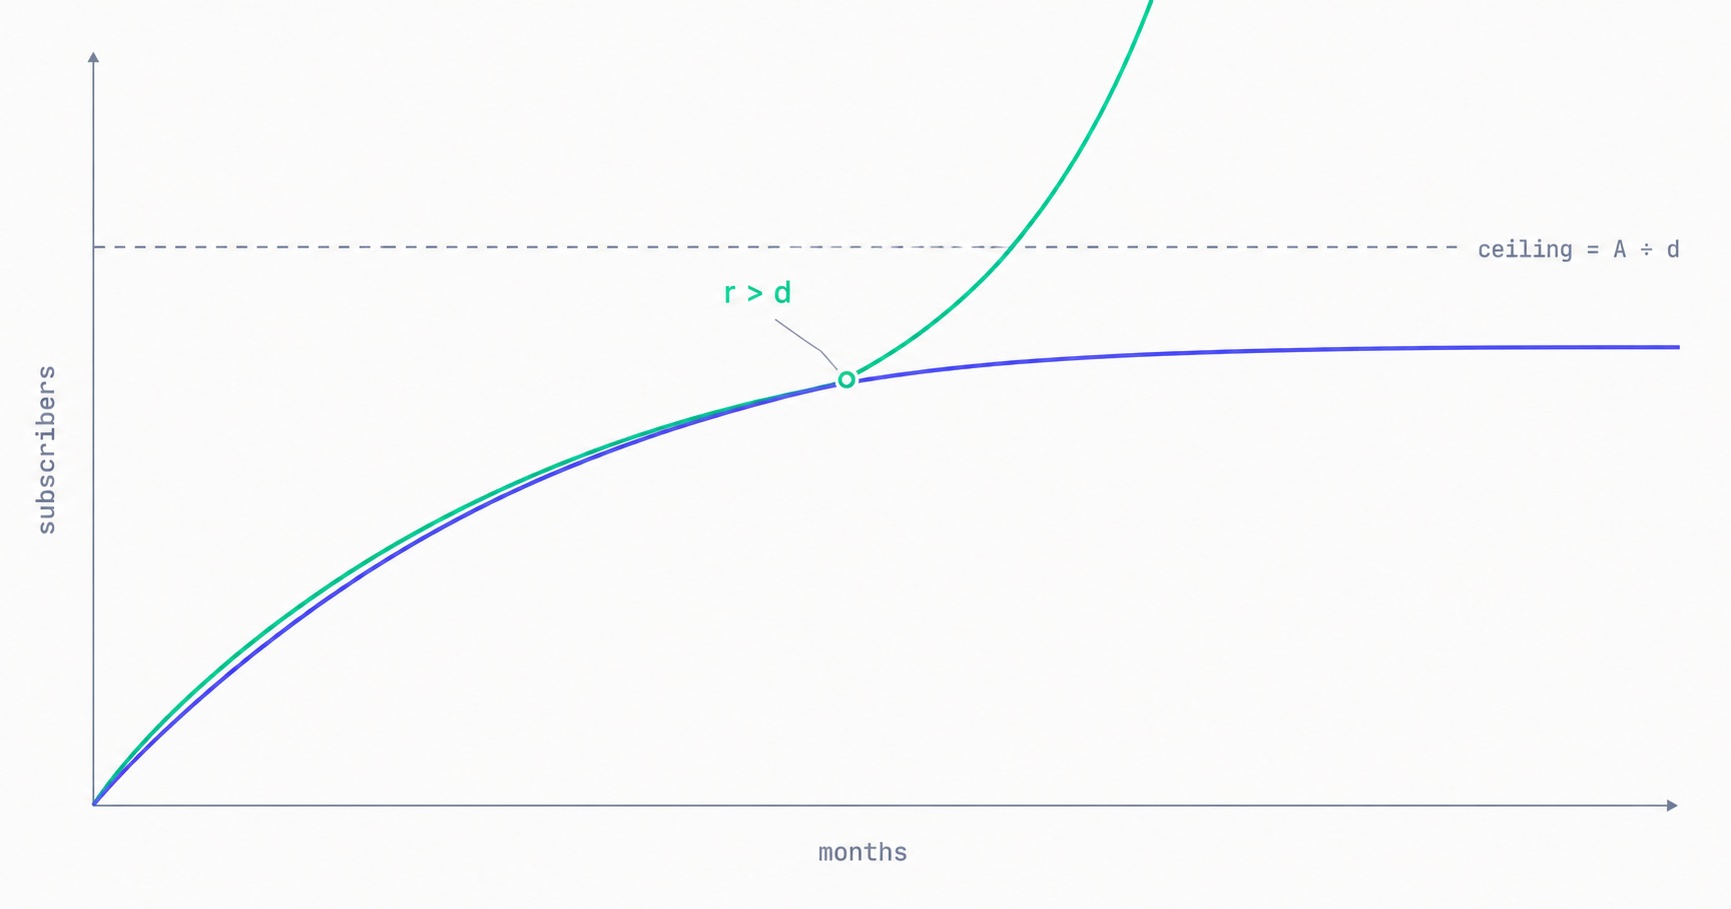
Your list has a maximum size you can calculate today: monthly new subscribers divided by monthly churn rate. At 500 signups a month and 2% churn, you will approach 25,000 and stop — no matter how long you keep publishing. The math behind the plateau, why halving churn beats doubling acquisition, and the one term that removes the ceiling entirely.

How to Create a Paid Membership Newsletter: Tiers, Pricing, and Content Strategy
Paid newsletters generate revenue that compounds with every subscriber and is immune to algorithm changes. The complete framework: pricing that reflects actual content value, the free-to-paid content split that converts without giving everything away, founding member launch mechanics, retention systems that reduce churn, and the platform fee math that decides how much you actually keep.
Newsletter Analytics for Creators: The 8 Metrics That Actually Matter (And 5 to Ignore)
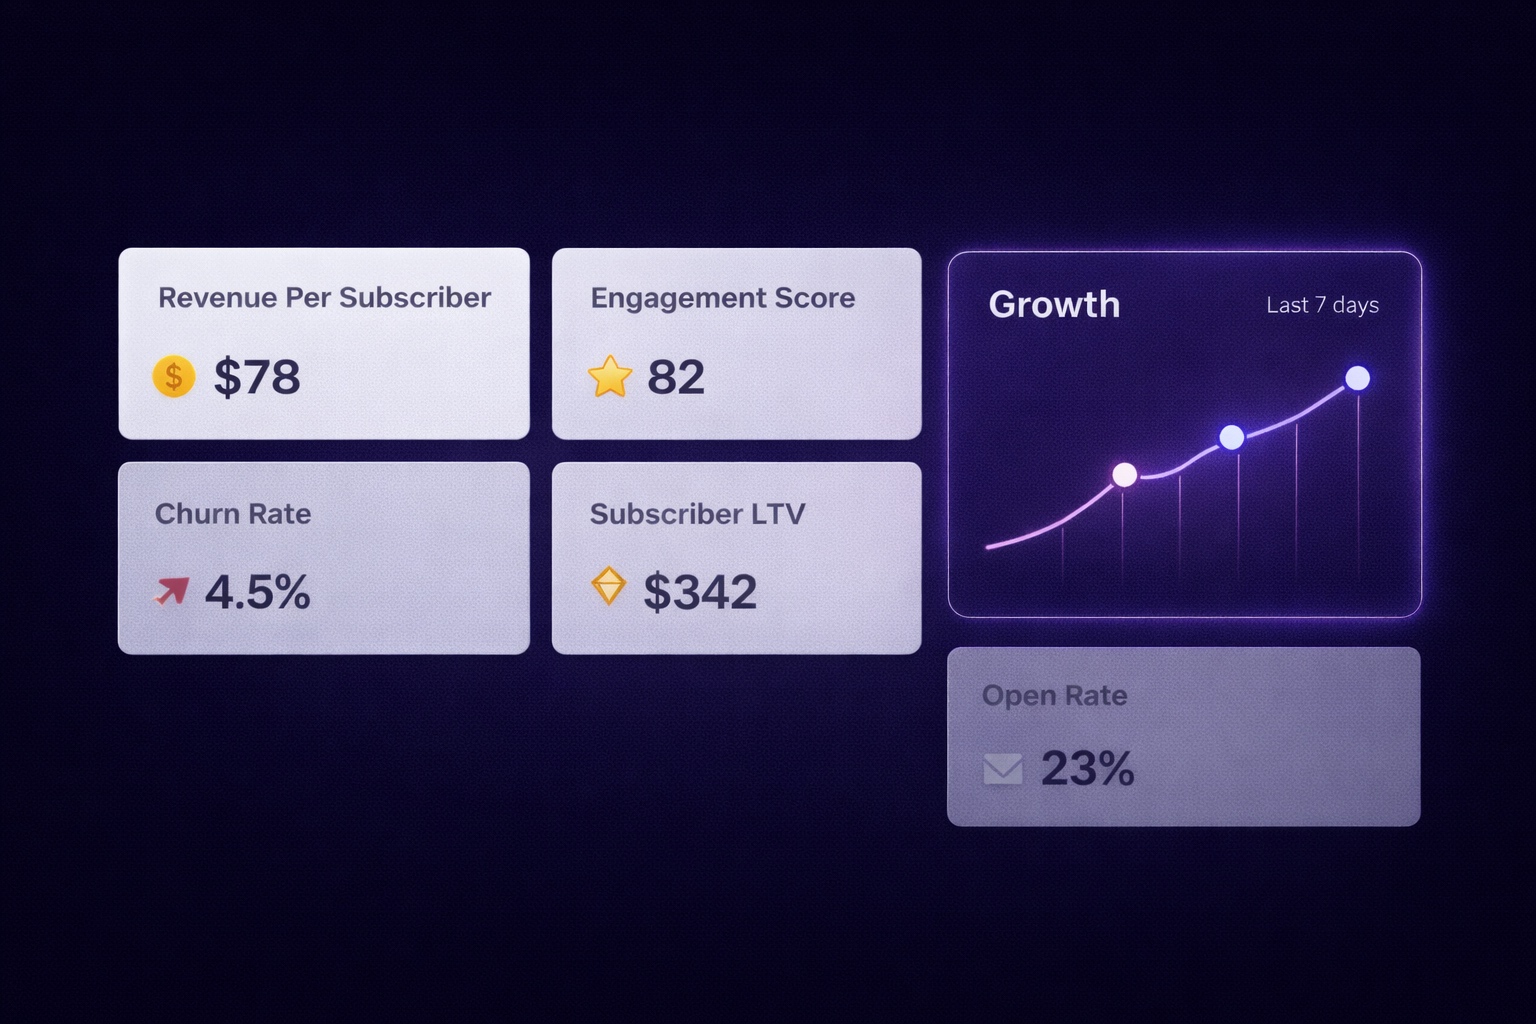
A 60% open rate sounds great until you realize it's from 800 people and you're earning $0.08/subscriber. The metrics that actually predict newsletter success — revenue per subscriber, engagement score, churn rate, CPM efficiency, subscriber LTV — and what good looks like at every stage.

How to Launch a Paid Newsletter: Complete Step-by-Step Guide for 2026
The paid newsletter market is $2B+ and growing. But most creators launch wrong — wrong pricing, wrong timing, wrong content split. This is the definitive playbook: when you're actually ready, how to price it, the 14-day pre-launch sequence, and why 0% platform fees matter enormously at scale.

They Unsubscribed, Then Signed Up Again. Now What?
Only the reader can reverse an unsubscribe. A fresh signup is a request, not proof. Why imports, forms and bulk edits quietly resubscribe people, and how to build a confirmation step that a link scanner or a stranger cannot trigger.

Your List Grew 1,500 Overnight. None of Them Are Real.
A signup spike with no launch behind it is usually list bombing. Fifteen hundred fake signups can push a welcome stream to six times Gmail's complaint limit and overstate your list by 30% to sponsors. How to spot them, why Apple Mail hides some, and how to clean up without making it worse.

Moving Your Newsletter? The List Is the Easy Part.
The CSV moves in five minutes. Sender reputation, unsubscribes, paid subscriptions, automations and old signup forms do not. The order that gets a newsletter to a new platform without losing inbox placement or emailing people who opted out.

You Cannot Pause a Newsletter. Only Stop Sending One.
Churn continues, acquisition stops, and sender reputation degrades fast while recovering over four to twelve weeks. Which makes an eight-week break cost far more than eight weeks — and makes reducing frequency a completely different decision from stopping.