Newsletter Analytics for Creators: The 8 Metrics That Actually Matter (And 5 to Ignore)
A 60% open rate sounds great until you realize it's from 800 people and you're earning $0.08/subscriber. The metrics that actually predict newsletter success — revenue per subscriber, engagement score, churn rate, CPM efficiency, subscriber LTV — and what good looks like at every stage.
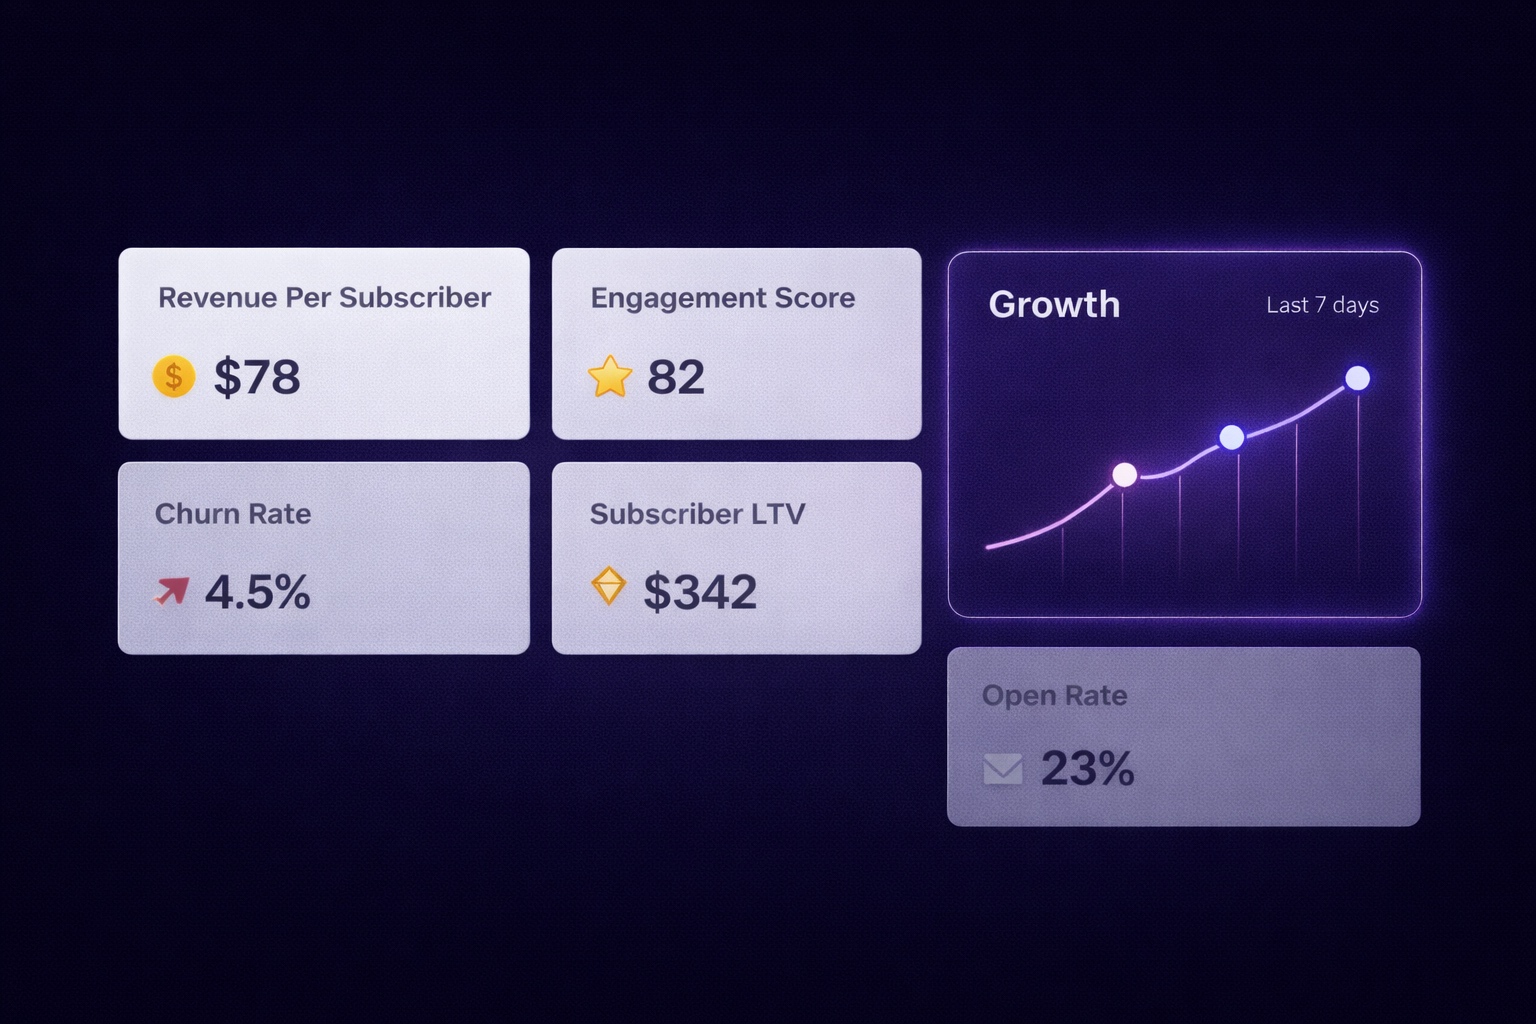
A creator with 8,000 subscribers and a 58% open rate is not necessarily doing better than a creator with 12,000 subscribers and a 31% open rate. But if you only look at open rates, you'd think the first creator was winning by a mile.
Open rate is the metric most newsletter creators obsess over. It's also one of the least useful metrics for understanding whether your newsletter is actually growing into a sustainable business. A 60% open rate on a disengaged list that never clicks, never upgrades, and never shares generates less revenue than a 28% open rate on a highly monetized, referral-driven list of engaged specialists.
The metrics that predict newsletter success — revenue per subscriber, engagement score, subscriber lifetime value, CPM efficiency — are rarely the ones being tracked. Most creators have access to these numbers but either ignore them or don't know how to interpret them. Meanwhile, they make major decisions (when to raise sponsorship rates, whether to launch a paid tier, which content to produce more of) based on vanity metrics that don't reflect the real health of their business.
This guide covers the 8 metrics that actually matter, what good looks like at different subscriber tiers, the 5 metrics to stop spending time on, and how to set up your analytics dashboard so the numbers you check weekly are the ones that drive better decisions.
The Metrics Trap: Why Most Creators Track the Wrong Things
Email marketing analytics were designed for e-commerce businesses and B2B marketing teams. Open rate, click rate, and unsubscribe rate were developed to measure campaign effectiveness for product promotions and sales sequences. They were never designed to capture what makes a newsletter valuable.
For a newsletter creator, the questions that actually matter are different: Are the right subscribers staying? Are they getting more valuable over time? Is the list generating revenue efficiently? Are the subscribers I'm attracting actually engaging? None of those questions are answered by a weekly open rate report.
The metrics gap: what platforms show vs. what matters
What email dashboards prominently display:
Open rate, click rate, unsubscribes, list size, delivery rate
What newsletter creators actually need to track:
Revenue per subscriber, subscriber lifetime value, list growth rate, engagement score, churn rate, CPM efficiency, referral conversion rate, paid-to-free conversion rate
The difference between these two lists is the difference between monitoring activity and managing a business.
The 8 Metrics That Actually Predict Newsletter Success
Metric 1: Open Rate (With the Right Context)
What it measures:
The percentage of delivered emails that were opened. Despite its limitations as a standalone metric, open rate is still a useful signal when interpreted correctly — primarily as a measure of subject line performance and sender reputation relative to your historical baseline.
What good looks like:
- Under 1,000 subscribers: 35-55% (small lists with engaged early adopters)
- 1,000-10,000 subscribers: 30-45% (healthy engagement at growing scale)
- 10,000-50,000 subscribers: 25-38% (scale naturally dilutes engagement)
- 50,000+ subscribers: 20-32% (still strong at scale; top performers exceed this)
The important caveat:
Apple's Mail Privacy Protection (MPP), introduced in 2021, inflates open rates for subscribers using Apple Mail (typically 40-60% of newsletter audiences). Any creator with a significant Apple Mail readership will see inflated open rates that don't reflect true engagement. Use click rate as a more reliable engagement signal when open rate accuracy is uncertain.
How to use it:
Track open rate issue-by-issue to identify subject line patterns. Track it week-over-week as a trend line. Don't use it to compare yourself to other newsletters — audience composition, niche, and email client mix make cross-newsletter comparisons unreliable.
Metric 2: Click Rate (The True Engagement Signal)
What it measures:
The percentage of delivered emails where at least one link was clicked. Unlike open rate, click rate is not affected by Apple's MPP tracking change — a click is a definitive action that cannot be proxied or inflated.
What good looks like:
- Click-to-open rate (clicks ÷ opens): 15-30% is strong; below 10% suggests content-to-audience mismatch
- Click rate (clicks ÷ delivered): 3-8% is strong for most newsletter formats; tutorial-style content typically achieves 5-12%
Why it matters more than open rate:
Sponsors and advertisers increasingly use click rate — not open rate — as their primary metric when evaluating newsletters. A 35% open rate with 2% click rate will command lower sponsorship rates than a 28% open rate with 8% click rate. If you plan to monetize via sponsorships, click rate is the number that directly affects your income.
How to improve it:
Contextual links embedded in content outperform standalone "click here" CTAs by 2-3x. Links that continue a thought ("here's the study I referenced") outperform links that interrupt the flow ("sponsor link below"). Place your most important link in the first third of the email — it gets 40% more clicks than the same link in the second half.
Metric 3: Revenue Per Subscriber (RPS)
What it measures:
Total monthly revenue from all sources ÷ total active subscribers. This is the most important single metric for a monetized newsletter — it tells you how efficiently your list is generating income and whether that efficiency is improving over time.
How to calculate it:
Add up all newsletter revenue for the month: programmatic ad revenue + direct sponsorship fees + paid subscription income + affiliate revenue + any product sales attributable to the newsletter. Divide by your active subscriber count.
What good looks like:
- Programmatic ads only: $0.05-0.20/subscriber/month (early stage)
- Ads + direct sponsorships: $0.20-0.80/subscriber/month (growing monetization)
- Full stack (ads + sponsors + paid subs): $0.50-3.00/subscriber/month (mature monetization)
- High-value niche with paid tier: $2.00-8.00+/subscriber/month (finance, B2B, high-intent niches)
Why it matters:
Two newsletters at 10,000 subscribers can generate wildly different revenue. If your RPS is $0.10/subscriber and a comparable newsletter in your niche is at $1.00/subscriber, you have a monetization gap to close — not a list size problem. Check our full guide to email list monetization strategies to identify which revenue streams to add first.
Metric 4: List Growth Rate
What it measures:
The percentage by which your active subscriber count grew in a given period. Calculated as: (New subscribers - Unsubscribes - Inactives removed) ÷ Starting subscriber count × 100.
What good looks like:
- Early stage (under 2,000 subs): 15-30%+ monthly growth is achievable and necessary for momentum
- Growth stage (2,000-20,000 subs): 8-20% monthly growth signals healthy acquisition
- Scale stage (20,000+ subs): 3-8% monthly growth is strong — absolute numbers are large even at lower percentages
Gross growth vs. net growth:
Track both. Gross growth (total new subscribers added) tells you whether your acquisition channels are working. Net growth (new subscribers minus those lost) tells you whether you have a retention problem. A newsletter adding 500 new subscribers per month but losing 450 to unsubscribes and inactivity is stagnating despite strong acquisition. The referral program and welcome sequence are the two highest-impact levers for improving net growth.
Metric 5: Churn Rate
What it measures:
The percentage of subscribers lost per period (unsubscribes + inactive removals). Monthly churn rate = Subscribers lost ÷ Starting subscriber count × 100.
What good looks like:
- Free newsletter: 1.5-3% monthly churn is healthy; above 4% suggests content-audience mismatch or deliverability problems
- Paid newsletter: 1-2% monthly churn (12-24% annual); above 3% monthly signals retention problems that compound quickly
Where churn compounds badly:
A 3% monthly churn rate sounds manageable. Annually, it means losing 31% of your list. A 5% monthly churn rate means losing 46% annually. Churn compounds silently — many creators don't notice the problem until they've been running in place for 12 months, adding subscribers at the top while losing almost as many at the bottom.
Diagnosing churn:
Churn typically spikes after specific triggers: publishing inconsistency (missing issues), topic drift, sudden increase in promotional content, or a change in format. Monitor churn week-by-week alongside a log of what you published — the correlation between content changes and churn spikes tells you exactly what's causing the problem.
Metric 6: Engagement Score
What it measures:
A composite score — typically calculated by your email platform — that reflects individual subscriber engagement across opens, clicks, replies, and longevity. Unlike single-metric tracking, engagement score captures the overall quality of the relationship with each subscriber.
Why it matters more than aggregate open rate:
An open rate of 35% could mean 35% of your list is highly engaged, or it could mean 70% of your list opened 50% of issues. These are very different lists. Engagement scoring identifies the distribution — what percentage of your list is highly active (opens and clicks regularly), moderately active, or at risk of becoming inactive.
How to use it strategically:
- Highly engaged segment: These are your best candidates for paid tier upgrades, referral program promotion, and direct sponsorship pitches ("my most engaged 2,000 subscribers" is a compelling sponsor pitch)
- At-risk segment: Subscribers who opened initially but haven't engaged in 60+ days. Trigger a re-engagement sequence before they go fully cold
- Inactive segment: Consider removing after 90+ days of no engagement rather than paying to email them. Smaller active list = better deliverability = higher open rates
Metric 7: CPM Efficiency
What it measures:
Your effective CPM (cost per thousand impressions) from the sponsor's or advertiser's perspective — how much sponsors are paying per thousand subscribers reached. From your perspective: how efficiently you're monetizing your audience reach.
Calculating your effective CPM:
(Sponsorship fee ÷ subscribers) × 1,000 = your effective CPM. Example: $500 sponsorship fee ÷ 10,000 subscribers × 1,000 = $50 CPM.
What good looks like by niche:
- General interest / lifestyle: $20-40 CPM
- Marketing, growth, creator economy: $40-75 CPM
- Technology, SaaS, developer: $50-100 CPM
- Finance, investing, fintech: $75-150 CPM
- B2B, enterprise decision-makers: $100-200+ CPM
Why tracking this matters:
If your effective CPM is significantly below the niche benchmark, you're undercharging. Many creators leave 30-50% of potential sponsorship revenue on the table by pricing based on what feels right rather than what the market supports. Our guide to newsletter sponsorship rates covers exactly how to price based on your niche CPM benchmarks.
Metric 8: Subscriber Lifetime Value (LTV)
What it measures:
The total revenue generated by an average subscriber over the duration of their subscription. LTV = Average monthly RPS ÷ Monthly churn rate. Example: $0.50/subscriber/month revenue ÷ 2% monthly churn = $25 subscriber LTV.
Why it changes your growth decisions:
Once you know your subscriber LTV, you can make rational decisions about paid acquisition. If each subscriber is worth $25 in lifetime revenue, spending $2-3 to acquire one through paid ads generates a 8-12x return. Without LTV, creators either overbid (losing money on acquisition) or underbid (missing cheap growth opportunities).
The LTV improvement levers:
- Increasing RPS (adding monetization layers)
- Reducing churn (retention-focused content and community)
- Converting free subscribers to paid (the single biggest LTV multiplier)
The 5 Metrics to Stop Obsessing Over
- Raw subscriber count (without engagement context): A list of 50,000 cold subscribers generates less revenue than a list of 8,000 engaged specialists. Subscriber count is a vanity metric unless paired with engagement rate, RPS, and churn data.
- Daily open rate fluctuations: Open rates naturally vary by day, subject line, and current events. Checking daily open rates creates anxiety without insight. Track weekly or monthly trend lines instead.
- Unsubscribe rate per issue: A small number of unsubscribes after every issue is normal and healthy — it's list self-selection. Only worry about unsubscribe rate when it's trending upward over multiple issues or spikes dramatically after a specific piece of content.
- Social media follower count vs. subscriber conversion: How many Twitter followers saw a thread that mentioned your newsletter matters far less than how many clicked the link. Measure the conversion, not the exposure.
- Delivered vs. bounced rate (unless there's a specific problem): Delivery rate above 97% is normal and healthy. Checking this weekly without a specific concern is time spent on a metric that almost never requires action unless you have a deliverability incident.
Benchmarks: What Good Looks Like at Every Stage
At 500 subscribers:
- Open rate: 40-55%
- Click rate: 5-12%
- Monthly churn: under 4%
- RPS: $0.05-0.30 (early monetization)
- Key focus: Engagement quality and list growth rate — you're building the foundation
At 5,000 subscribers:
- Open rate: 32-45%
- Click rate: 4-9%
- Monthly churn: 2-3%
- RPS: $0.20-1.00 (programmatic ads + first sponsors)
- List growth rate: 8-20% monthly
- Key focus: RPS growth — at 5K subscribers, closing the gap from $0.20 to $1.00 RPS is the highest-leverage move
At 50,000 subscribers:
- Open rate: 24-36%
- Click rate: 3-7%
- Monthly churn: 1.5-2.5%
- RPS: $0.50-3.00 (full monetization stack)
- Subscriber LTV: $15-50+
- Key focus: Churn reduction and LTV maximization — at scale, each percentage point of churn improvement is worth thousands of subscribers retained
Your Analytics Dashboard Setup in InfluencersKit
The weekly metrics review (15 minutes, once a week):
- Open rate and click rate for last issue — note subject line and content type for pattern tracking
- Net subscriber growth for the week — new adds minus unsubscribes and inactives removed
- Engagement score distribution — check what percentage of your list moved between engagement tiers
- Revenue for the week — programmatic ad earnings, any sponsorship payments received
The monthly metrics review (30 minutes, first Monday of each month):
- RPS — total monthly revenue ÷ active subscribers. Is it trending up?
- Monthly churn rate — are you losing subscribers faster than you should be?
- List growth rate — net growth percentage month-over-month
- Paid conversion rate (if applicable) — what percentage of free subscribers upgraded to paid?
- CPM efficiency — compare sponsorship rates charged vs. niche benchmarks
Setting up in InfluencersKit:
Navigate to Analytics → Dashboard. Pin the 8 metrics covered in this guide to your main dashboard view. Set up weekly email reports so your key numbers land in your inbox automatically — you're more likely to review metrics you receive than ones you have to go find.
Good analytics are only useful if they drive decisions. Once you know your RPS is below benchmark, the next step is identifying which revenue streams to add — start with programmatic ads (zero effort, immediate revenue on every issue), then move to direct sponsorships. Once you know your churn rate is above healthy, the highest-impact fix is usually improving your welcome sequence — because the first 21 days of a subscriber relationship determine whether they stay or leave.
Track the Metrics That Actually Build a Business
InfluencersKit's analytics dashboard is built for newsletter creators — not e-commerce teams. Revenue per subscriber, engagement scoring, churn tracking, CPM efficiency, and subscriber LTV are all tracked automatically alongside the standard open rate and click rate metrics. Everything in one view, updated in real time.
Start your free trial — connect your list and see your first real analytics report within 24 hours.
Stay Updated
Get the latest insights, strategies, and tips delivered directly to your inbox. Join thousands of creators who are building their email communities with our weekly newsletter.
No spam, unsubscribe at any time. We respect your privacy.
Related Articles

Your Readers Can Leave Without Ever Seeing Your Page.
Since 2024, Gmail and Yahoo require one-click unsubscribe. A mail-app button removes the reader instantly, with no page, no options and no reason. Your preference centre now reaches only footer-link leavers, so the 'less, not none' options belong inside the email.
Apple Broke Your Open Rate. And Your Subject Line Tests.
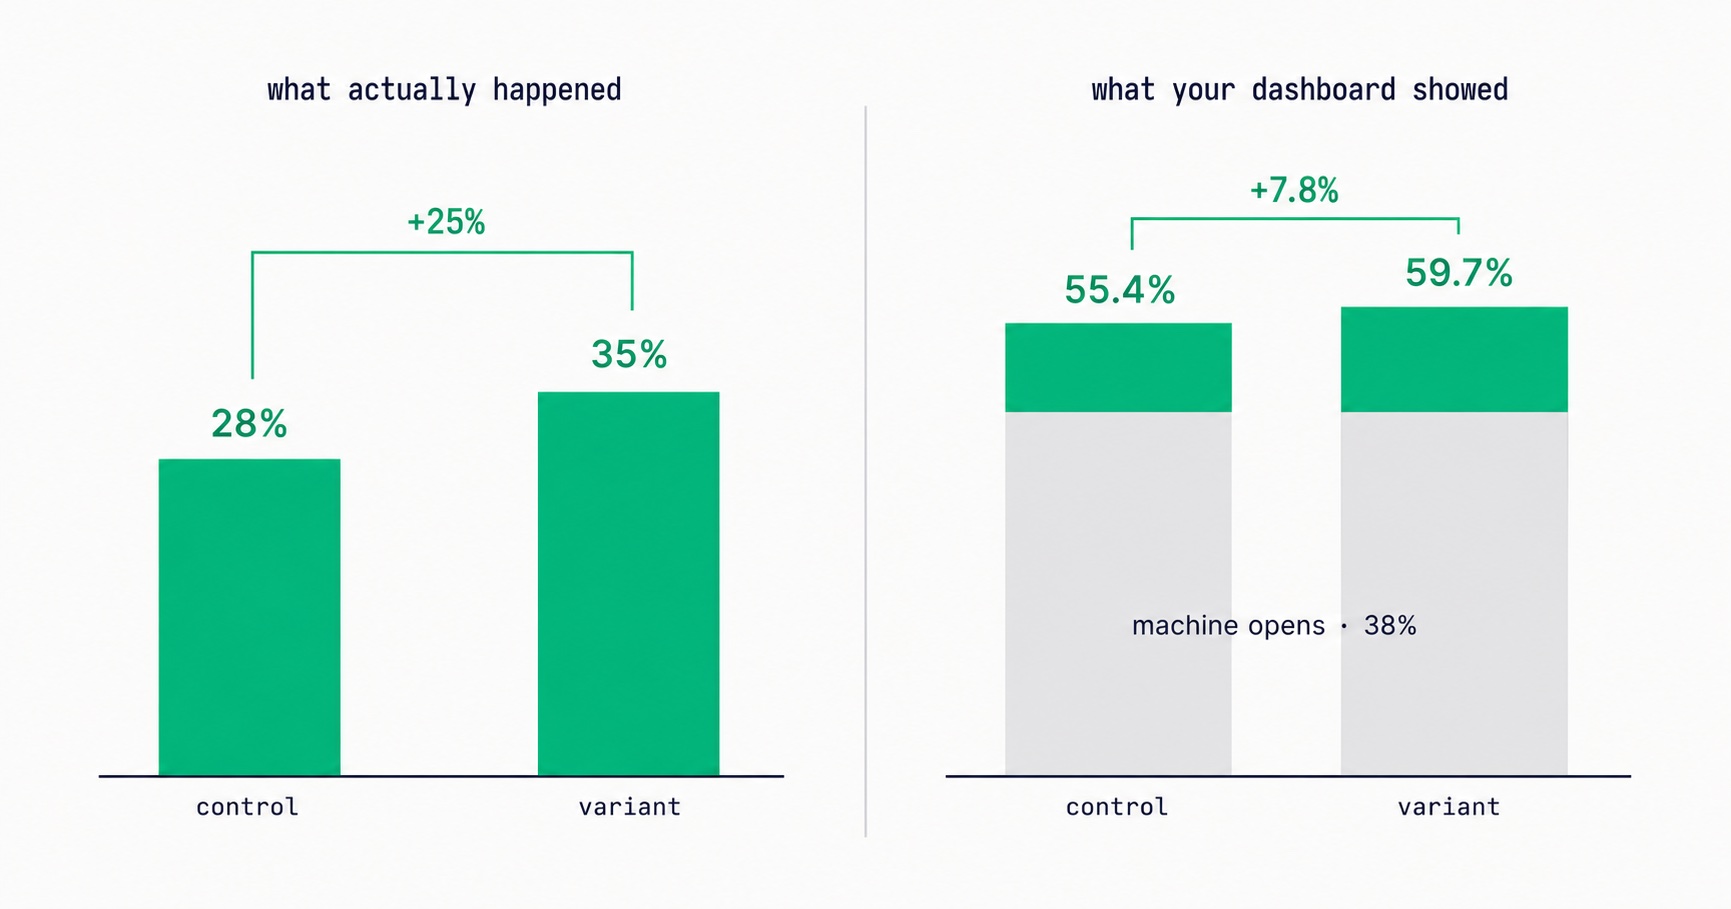
Every article about Apple Mail Privacy Protection says open rates are unreliable. None of them explain the part that actually changes your decisions: MPP doesn't add random noise, it systematically compresses the measured gap between two subject lines by roughly 3x — which is why so many creators ran good tests, saw flat results, and concluded subject lines don't matter.

They Unsubscribed, Then Signed Up Again. Now What?
Only the reader can reverse an unsubscribe. A fresh signup is a request, not proof. Why imports, forms and bulk edits quietly resubscribe people, and how to build a confirmation step that a link scanner or a stranger cannot trigger.

Your List Grew 1,500 Overnight. None of Them Are Real.
A signup spike with no launch behind it is usually list bombing. Fifteen hundred fake signups can push a welcome stream to six times Gmail's complaint limit and overstate your list by 30% to sponsors. How to spot them, why Apple Mail hides some, and how to clean up without making it worse.

Moving Your Newsletter? The List Is the Easy Part.
The CSV moves in five minutes. Sender reputation, unsubscribes, paid subscriptions, automations and old signup forms do not. The order that gets a newsletter to a new platform without losing inbox placement or emailing people who opted out.

A Subscriber Is Worth $1.25 a Year. Now Price Your Ads.
Two sponsored slots at a $30 CPM with a 40% open rate earn about $1.25 per subscriber per year. Against a defensible CAC near $2 and cost-per-signup commonly $2-5, most paid acquisition is at or past break-even before you account for paid cohorts converting worse than organic ones.

Your Free-to-Paid Rate Is Two Numbers Pretending to Be One
Long-tenured subscribers convert three to five times better than new ones, and later cohorts are acquired more broadly than early ones. Both effects correlate with join date, so they cancel inside your blended conversion rate — and the two situations they describe call for completely opposite responses. The same-tenure comparison that separates them.
Your Newsletter Has a Growth Ceiling. Here's the Formula.
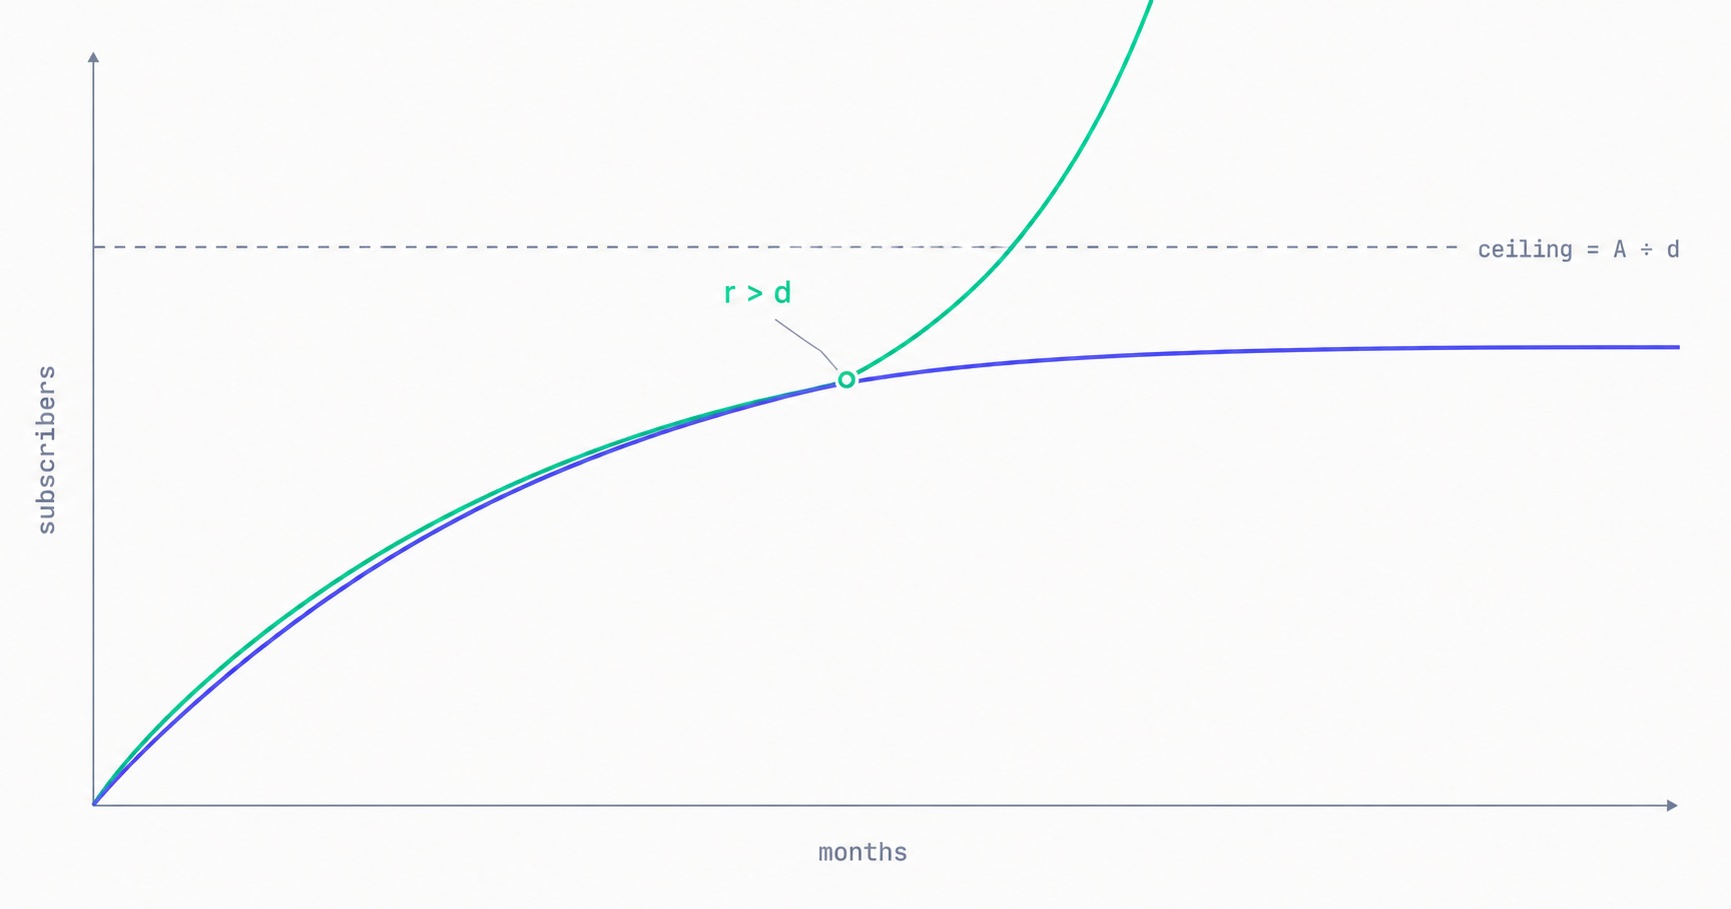
Your list has a maximum size you can calculate today: monthly new subscribers divided by monthly churn rate. At 500 signups a month and 2% churn, you will approach 25,000 and stop — no matter how long you keep publishing. The math behind the plateau, why halving churn beats doubling acquisition, and the one term that removes the ceiling entirely.

Newsletter Reactivation: How to Win Back Inactive Subscribers (With Templates)
Every newsletter has inactive subscribers silently dragging down deliverability. A well-designed reactivation campaign recovers 8–20% of them while identifying the truly unrecoverable. The four-part reactivation sequence, subject lines that break through inbox habituation, the list hygiene logic that improves metrics after removal, and the onboarding system that prevents inactivity from accumulating in the first place.

Email Marketing for Online Coaches: Build Your List, Nurture Prospects, Fill Your Program
Coaching has a long sales cycle — clients need weeks of trust-building before they commit. Email is the only marketing channel that matches this cycle structurally. The complete system: how to build a list that attracts your ideal client profile, the 7-email welcome sequence that pre-qualifies prospects, and how to run enrollment conversations through email without feeling salesy.
Newsletter Segmentation for Creators: Send the Right Email to the Right Subscriber
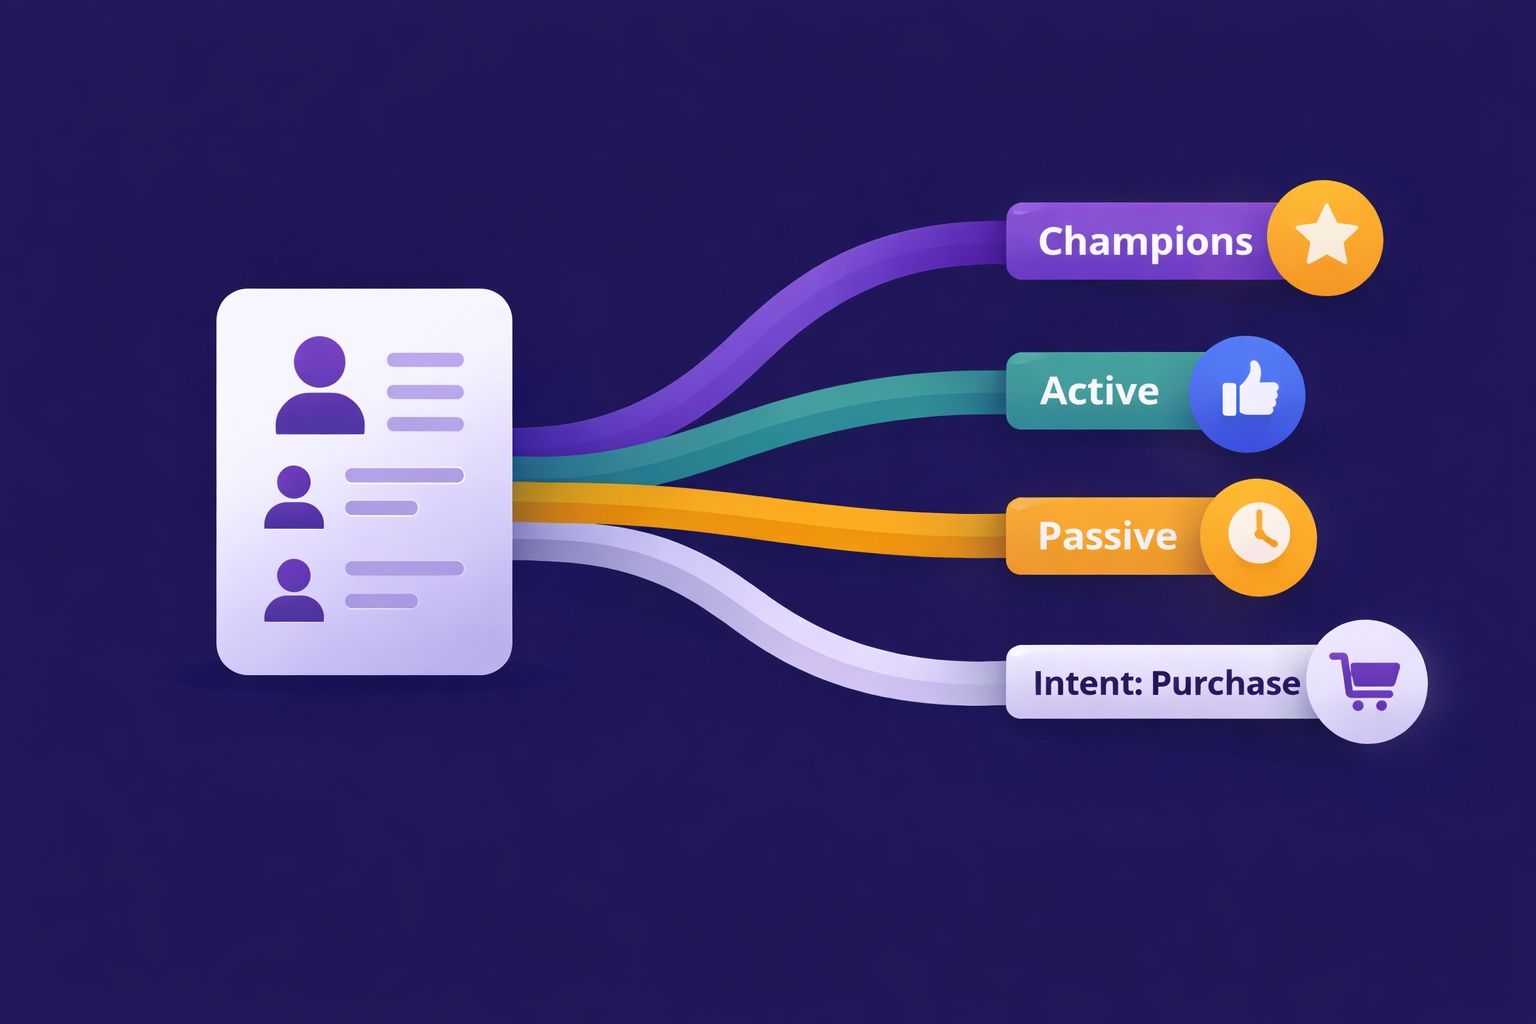
Segmentation is the gap between 25% open rates and 45% open rates — and between 3% paid conversion and 9%. The 5 segmentation types that move the needle, the exact tags to set up from day one, and how to build a behavioral targeting system that runs automatically in InfluencersKit.

Email Deliverability for Newsletter Creators: Why Your Emails Land in Spam (And How to Fix It)
Deliverability is the silent newsletter killer — a 30% spam rate cuts your revenue potential by 30% while your dashboard shows 98% delivered. SPF, DKIM, DMARC in plain English, list hygiene that protects your sender reputation, the tools to diagnose the problem, and a 7-day recovery plan.